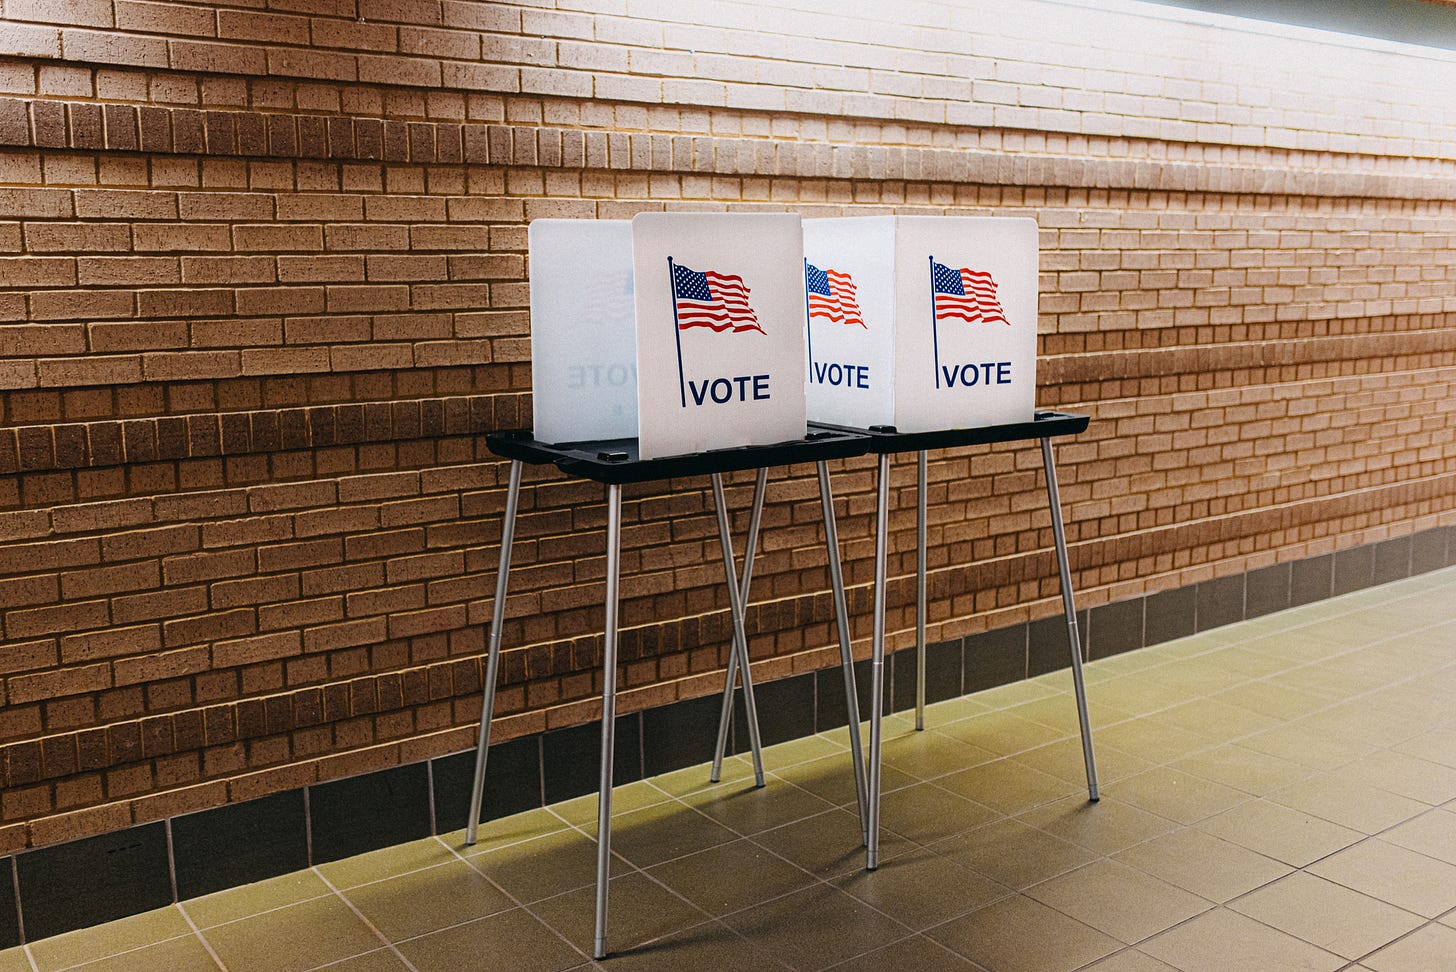
A Detailed Analysis of What I Think Will Happen in Today's Election
I have charts and graphs and a model and everything
Well, folks, the big day is finally here.
After months of grueling campaigning and a billion-dollar onslaught of TV ads, we’ve arrived at Election Day here in the United States. Vice President Kamala Harris and former president Donald J. Trump are facing off at a critical juncture in this nation’s history, and many pollsters and pundits are reporting the race as a virtual tie.
Is it, though?
Can we really not predict what’s going to happen today?
I’m skeptical.
Now, I may not have mentioned this before, but I’ve done some dabbling in data science. I’ve spent the last few weeks collecting as much polling data as I can, then feeding that data in my proprietary model, which weights the raw data for demographics, party affiliation, past election results, weather conditions, strength of schedule and more.
Using this model, I’m able to offer you a detailed prediction of what I think is likely to happen today—I’ve even produced some lovely full-color charts and graphs.
First of all, the Midwestern states are going to be very important.
Donald Trump’s surprise victory in 2016 came through the so-called “blue wall” states of Michigan, Wisconsin and Pennsylvania, and flipping those states back to blue allowed Joe Biden to win in 2020.
Here’s a county-by-county breakdown of what I think the “blue wall” will do this year:
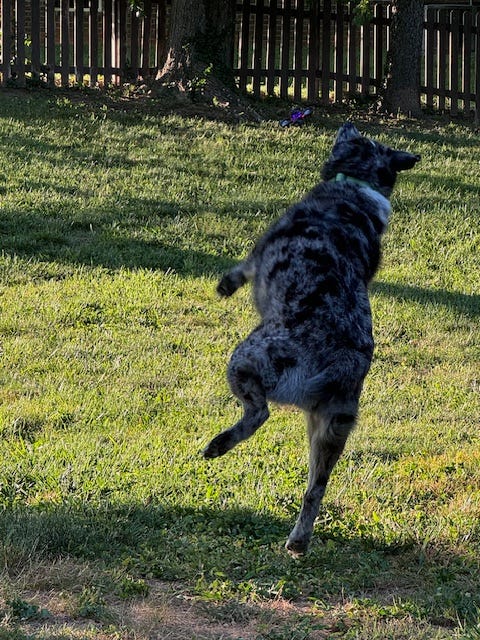
Huh. That’s just a picture of my dog Olaf trying to chomp my son’s toy drone out of the sky. I must’ve messed up the filename on that one.
Well, let’s just move on.
I’m sure the rest of the data is fine.
The Sun Belt offers an alternate path to victory
If Vice President Harris loses one of the “Blue Wall” states, she may be able to make up the Electoral College deficit by retaining newly-blue Georgia or Arizona, or even flipping recently-red North Carolina.
If that’s to happen, here’s where I think the votes will come from:
Weird. That’s just another photo of Olaf leaping for the drone. There must be some sort of glitch in the model.
I bet I can get it fixed, though. Let’s keep going.
Early-voting numbers can be hard to read
In 2020, early and mail-in voted had a strong Democratic lean, presumably owing to liberal voters’ greater caution at the height of the pandemic. Many states have expanded their early voting options this cycle, and more than 75 million voters have already cast their ballot before Election Day. It’s hard to read exactly what those early numbers mean, as party affiliation isn’t necessarily a reliable indicator of how people are voting.
Here’s what benchmarks the model thinks each candidate will need to hit in the early-vote totals to have a chance at victory tonight:
[smacks top of model] the heck is this thing doing
What’s going on in Iowa?
Iowa went for Trump by nearly eight percentage points in 2020, but a late poll from highly-respected Des Moines Register pollster Ann Selzer shows Harris with a three-point lead in the Hawkeye State.
If that result pans out, here’s what I think that might mean for the rest of the Midwest:
[fiddling with wires on the back of the computer] I could’ve sworn I put polling data in here
What results might provide early insight into how the night is going?
It’s hard to know exactly when we’ll know a winner. In 2020, the election wasn’t officially called for four days, but signs pointed strongly to a Biden victory by the early hours of Wednesday morning. Where should we look first tonight?
Polls begin closing in the Eastern Time Zone at 6pm, and the model predicts that results in these locations could give us a strong sense of the overall direction of the race:
[not even looking]
it’s the dog again isn’t it
whatever
A gender gap could decide the election
In the wake of the Supreme Court’s decision to overturn Roe v. Wade in the Dobbs decision, the outrage of women voters is expected to be critical in 2024.
Many polls showing the race as a “virtual tie” have modeled an electorate that is 52% female—but recent elections have seen that number closer to 54%, and some of the early vote totals are even higher. If women end up comprising 55% of this year’s electorate, the model would expect a map something like this:
oh dang he almost got it that time
Will young voters turn out this time?
Gen Z is a politically-minded generation, but it can be extremely difficult to model the behavior of younger voters, who often haven’t established consistent voting habits on par with older generations. The model factors in this volatility, offering a range of outcomes based on the variable turnout of voters aged 18-29:
this is no less informative than anything else you’ll read this morning, you know
Is election forecasting completely worthless these days?
Are professional pundits so deeply shaken by their failure to properly predict the past two elections that they’ve simply herded their data into a mushy consensus of “it’s a coin-flip”, the sort of non-prediction that insulates them from being yelled at once again but offers no insight of any value whatsoever?
It’s too early to say, of I suppose.
That said, I’ve fed each of their models into my model, and here’s where I think their performances rank:
awww look he got tired after all that jumping
but he had a good time
who’s a good election model? you’re a good election model. yes you are.
In all seriousness, folks, take care of yourselves today.
It’s gonna be a long day, and it’s okay to disconnect. (Advisable, even!) Take a walk, read a book, pet a dog, drink some water.
Oh, and also, vote. If you haven’t done that already, you probably should!
We hold the future of this country in our hands, and we are not going back.
—Scott Hines (@actioncookbook)


Olaf 2024
Well, that settles it. I'm voting for Olaf.